Ayla Insights: Onboarding Analysis
The Onboarding Analysis report (shown below) provides a comparison of activated and registered devices for two different date ranges that you specify in the filters.
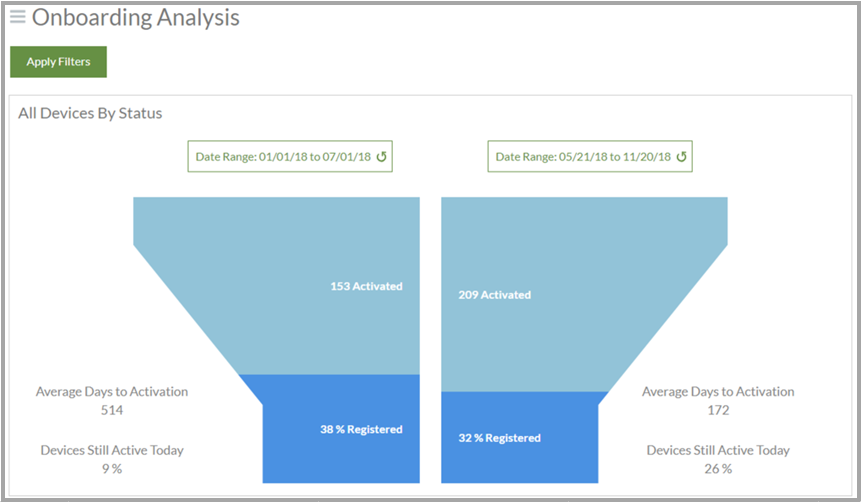
Notice in the example above that on each side (shown as a funnel), the upper portion of the report provides the number of activated devices per the specific date range (shown at the top). Then, the bottom of the report (both sides) shows the percentage of the activated devices that were registered during the same date range. By default, the right side shows device activations and the percentage of those devices registered for the past 6 months from the current date, and the left side shows the same information for a 6-month range prior to the date range on the right side.
|
NOTE |
Once onboarded and sending data to the cloud, the device is considered “activated.” If still sending data to the cloud in the past 30 days, the device is considered “active.” |
Additionally, each side of the Onboarding Analysis report (funnel) shows the following data:
- Average number of days to activate and register devices. This information can tell OEMs, for example, how well they are doing in terms of devices being activated and registered.
- Percentage of devices still active today. This indicates whether the devices are still being used or not.
How to get here on the dashboard: Click Ayla Insights in the Navigation Panel, sign in to Ayla Insights, then click Overview in the Navigation Panel for Insights.
See also: Ayla Insights, Insights Overview Reports, Insights Device Trends Reports, Insights Device Software Analysis Reports, Insights Device Transmission Analysis Reports, Insights Device Details Reports, Insights User Analysis Reports, Insights Notification Analysis Reports, Insights Datapoint Transmissions Trends Reports, Insights Datapoint Analysis Reports.
Please click here to let us know how we're doing. Thank you.